3 min read
A Look At Volatility As It Relates To Crude Oil Hedging
In the most recent version of This Week in Petroleum, the EIA published an article on historical vs. implied volatility in Brent crude oil which...
4 min read

Volatility and time are just as important to understanding option premium as intrinsic value. This is especially true for a hedger who uses out of the money options, likely with a preference that the option expires out of the money, which means it has zero intrinsic value. Time and volatility are sources of value above intrinsic value throughout the life of the position until expiry.
Time is the easiest variable to understand. Longer durations have more time value. As the days tick away toward expiration, the value of time falls. This is called time decay, which is estimated by Theta. Theta is typically measured as a function of one day – for every day closer to expiry, the premium falls by the Theta. To demonstrate, let’s look again at deep (out-of-the-money) OTM calls. On 28 November 2018 a $100 Brent call for the December contract had a premium of about $0.28 and a theta of 0.001. If nothing else changed between 28 November 2018 and 29 November 2018, $0.28 would fall to $0.279. The option will lose value every day until it expires. On 28 November 2018, with 354 days to expiration, theta is very small and premium decays slowly. As time progresses this decay gets larger, growing at a faster rate as expiry approaches, until time value falls to $0.00, and the option is 100% intrinsic value, which will be some value ≥$0, depending on whether the option expires in or out of the money. Think of it like the flight path of a paper airplane: it glides sort of gently at first, but as it loses momentum it starts to descend, until it eventually nosedives and crashes.
Volatility is a bit more difficult to understand because we can’t observe volatility directly. For valuing options, we only care about the volatility between the date of execution and expiry. In other words, we need future volatility. There is no way to know the future, unfortunately. That forces us to use what is known as implied volatility. If we know the strike, time to expiry, the price of the underlying, and interest rate, we can derive the volatility necessary to output a given premium. We basically just solve for the missing variable in the options model. Implied volatility is the best of several imperfect choices. It changes, so can’t be assumed to be a forecast of future volatility. At least it allows us gauge the market's current assumption of volatility as a benchmark to measure the option’s premium’s sensitivity to change in volatility.
An option’s sensitivity to change in implied volatility is given by its Vega, which is also known as Kappa. Vega estimates the change in option premium caused by a 100 basis-point (1%) change in implied volatility. As implied volatility rises, the premium of all options rises, thus all options have positive Vega. Referring again to December 2019 $100 call, on 28 November 2019, the premium was $0.28, the Vega was 0.03 and the implied volatility was 31.65. If the volatility rose to 32.65, the premium would rise to $0.31.
$0.28 premium+[(32.65-31.65)×0.03 Vega]=$0.28+$0.03=$0.31
Out of the money options, though they tend to have lower Vegas than at-the-money options, are more sensitive to changes in implied volatility when considered as a percentage of the option premium. For example, the at-the-money call option for December 2019 Brent had a Vega of 0.195 on 28 November 2019 and a premium of $7.62.
$7.62 premium+[(32.65-31.65)×0.195 Vega]=$7.62+$0.195=$7.815
(0.195 Vega)/(7.62 premium)=2.6% (0.03 Vega)/(0.28 premium)=10.7%
You can see, the absolute change in premium is smaller for the OTM option, but percentage change is much higher.
In all of these examples, just like in textbooks, we demonstrate changes in premium caused by each variable holding everything else constant. That isn’t realistic. In reality, time, volatility, and the price of the underlying are all related and all change simultaneously. Let’s look at how the $100 call premium has changed as December Brent has changed over the period 28 November 2019 through 31 May 2019.
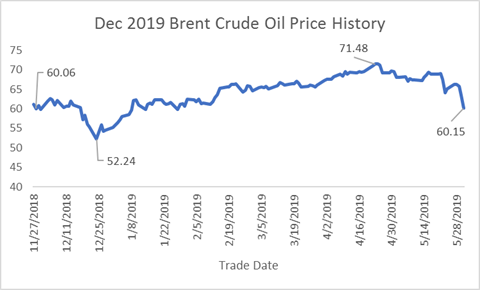
On 28 November, December Brent closed at $60.06/bbl. It fell to a low close of $52.24 on 24 December 2018, then rose over the next four months to reach a high close of $71.48 on 23 April 2019. The December contract ultimately fell back to $60.15 by the end of May, not far from the starting point of our analysis period.
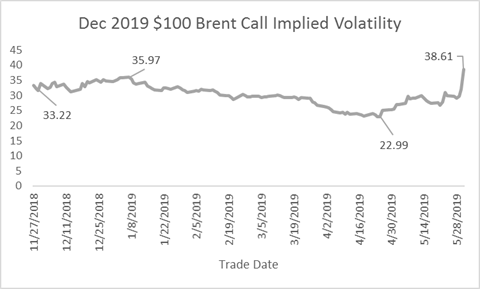
Over that same period, the implied volatility started at 33.22, rose to an initial high of 35.97, fell to a low of 22.99. The implied volatility of the $100 call eventually reached its high for the period of 38.61, as prices fell at the end of May.
The premium of the $100 call over this period started at $0.28, fell to an early low of $0.08 in December, then rose to a high of $0.37 in early January, before working its way down to just $0.07. The premium ended the month at $0.14.
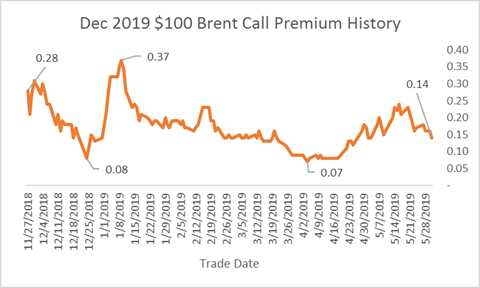 Notice how the tops and bottoms for premium, volatility, and the price of the December 2019 Brent futures are recorded on different days. Brent settled at $67.54 on 4 April 2019, the day that the premium recorded its low of $0.07. At the end of May, Brent had fallen to a close of $60.15, but the premium of the $100 call rose to 0.14 because volatility jumped from 24.74 to 38.61. This is despite the passing of approximately 40 days causing time decay to the premium.
With all of these moving parts, valuing an option can be difficult. This complexity is why traders seldom use options, especially deep OTM options, to speculate on the price of any commodity. This complexity also creates opportunities for hedgers to be more strategic about risk management. It just takes a bit more work to know when and how to use options to mitigate risk within budget.
3 min read
In the most recent version of This Week in Petroleum, the EIA published an article on historical vs. implied volatility in Brent crude oil which...
2 min read
This post is the second in a series on crude oil options. This first post in the series can be found via the following link: A Beginner's Guide to...
2 min read
Since bottoming near $77/BBL in early October, the 2012 WTI calendar strip has increased by more than $20 a barrel, trading as high as $101 in mid...