4 min read
Oil & Gas Hedging: What Can be Learned From the Past?
While not nearly as unnerving as the decline from $13 in the summer of 2008 to under $3 in 2009, the recent volatility, amid a low price...
2 min read
While NYMEX natural gas futures are often referred to as the widowmaker of the energy trading world, the recent collapse in the Brent-WTI crude oil spread has likely produced a few widows of her own. For those of you who don't watch the Brent-WTI spread closely, the spread is once again trading near parity. As such thought it would be a good time to review the Brent-WTI spread and the potential implications as it relates to crude oil and refined product price risk management.
While the Brent-WTI spread traded as high as $15 last January, WTI is once again battling for the throne, with the front month spread settling at $0.21/BBL yesterday and WTI briefly trading at a premium to Brent on Monday. What's driving the change? Many factors but none more so than demand or the lack thereof.
In recent months, US refineries have been operating at over 90% capacity, which has bolstered demand for US crude oil. In addition, despite the significant price decline, US crude oil production has been quite resilient, rising to 9.14MM BPD in mid December, the highest on record according to EIA data dating back to 1983. This isn't to say the US production levels will remain at record highs if sub $50 prices become the new normal but, for the time being, US production remains strong.
On the contrary, demand in Europe is modest at best with the IEA forecasting year-over-year oil demand in Europe to decline by 150K BPD in 2015. In addition, disappointing international economic news continues to influence crude oil prices to the downside. Furthermore, the potential of a Greek exit from the Eurozone clearly isn't bullish for Eurozone economies.
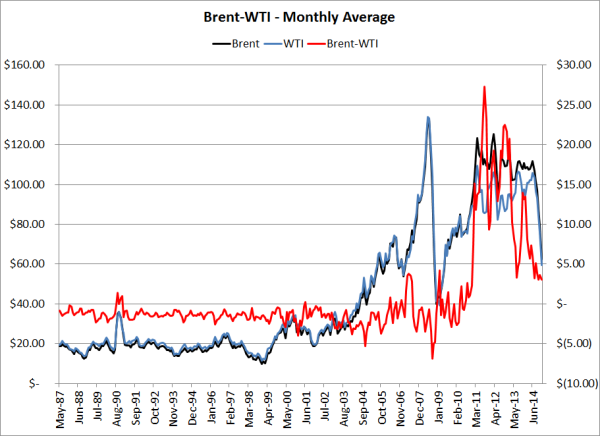

To put the Brent-WTI spread into better perspective, based on monthly average price data, since May 1987 WTI has traded at an average premium of $0.65/BBL over Brent. Except for a few rare occurrences, it took nearly 30 years for Brent to trade at a meaningful premium to WTI. However, since becoming the king of the complex in August 2010 Brent has traded at an average premium of nearly $12/BBL including more than $25/BBL in late 2011. Fast forward to today and the spread is essentially zero.
Clearly the shift in the spread has significant implications for producers, refiners, traders and consumers. As the charts and data points above indicate, whether you're happy with the recent shifts in the spread depends on where you're doing business and what products you're producing, trading, refining or consuming, not to mention how you were or are hedged, if at all.Consider the case of a fuel consumer who has hedged their fuel price risk with a costless collar on Brent while their actual fuel costs are more highly correlated to WTI. As the charts above indicate, they're clearly on the wrong side of the market. Based on publicly available data (i.e. quarterly and annual reports), there are at least several companies which are currently experiencing situations of this sort. In summary, if you are hedging crude oil or refined product price risk, you need to hedge with the product(s) that is most highly correlated to your actual exposure in the physical market, otherwise you're likely to find yourself in an undesirable situation.
Side note: If you're wondering what caused the brief Brent-WTI collapse in September 2008, it was little more than the commodity market circus which was all too present during the financial crisis. More specifically, between the end of trading on September 19 and 22, prompt WTI futures increased by $16.37/BBL while Brent "only" increased by $6.43/BBL.

4 min read
While not nearly as unnerving as the decline from $13 in the summer of 2008 to under $3 in 2009, the recent volatility, amid a low price...
3 min read
The prompt month NYMEX WTI contract settled at $107.26/bbl on June 20, 2014. That day would prove to be a major inflection point in the market. The...
1 min read
In an attempt to put things a few things in perspective, while noting that it's Friday and most are already enjoying the weekend, we've compiled a...