2 min read
Fuel Hedging In Volatile Markets With Call Option Spreads
It can't be denied that the recent volatility in the oil and fuel markets is proving to be quite challenging for many companies with active hedging...
2 min read
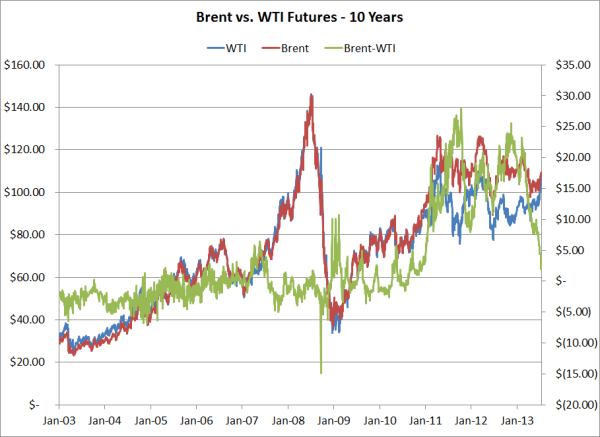
As the Brent-WTI spread is trading at it's lowest level since November 2010 and crack spreads shifting as a result, it's time that we take another look at both the crude spread and cracks spreads.
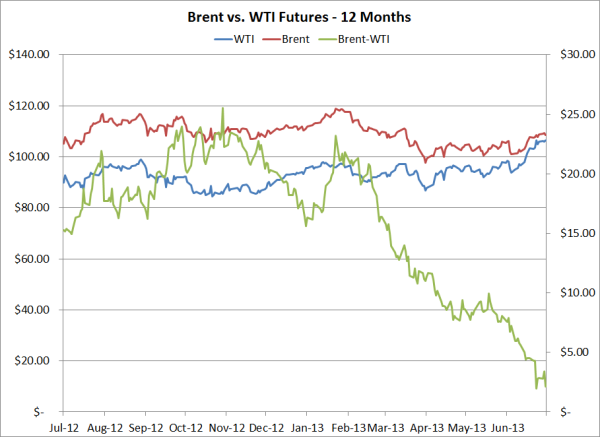
After trading in the mid $20s as recent as February, WTI continues to strengthen while Brent continues to lag, leading the Brent-WTI to settle yesterday at a mere $0.66/BBL. What's driving the change? For starters, US crude stocks have declined by 27MM barrels in recent weeks as refiners are processing more barrels. Based on the EIA data released yesterday, last week refiners processed more barrels than than in any week since the summer of 2005. In addition, the WTI curve is in a state of steep backwardation as evidenced by the October-September WTI spread widening to $1.52/BBL after trading as narrow as $0.14/BBL in early June.
To put the narrowing of the spread into better perspective, over the past ten years WTI has traded at an average premium of $3.20/BBL over Brent while year-to-date, Brent has traded at an average premium of $15.99/BBL over WTI.
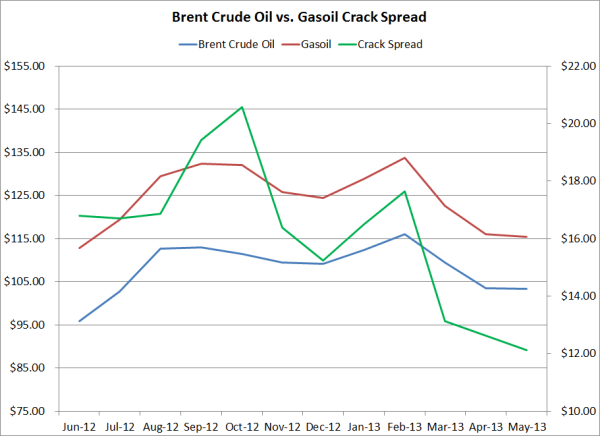
On the products side, the cracks spreads have been on a roller-coaster ride since the beginning of the year. As an example, the Gasoil-Brent crack has widened to $21.53/BBL after having traded as low as $9.20/BBL in early May. Similarly, the ULSD-Brent crack is trading at a twelve month higher, settling yesterday at 21.53/BBL, after trading as low as $11.65/BBL in March. On the other hand, the Gasoil-WTI crack is trading near a twelve month low at $16.62/BBL after having traded as high as $46.40/BBL in October. Likewise, the ULSD-WTI crack settled yesterday at $22.19/BBL, well below the twelve month high of $45.30/BBL.
Clearly the changes in both the crude and crack spreads have significant hedging implicatons for producers, refiners and consumers. As the charts above indicate, whether you're happy with the recent shifts in the spreads depends on your where in the world you're doing business and what product you're producing, refining and/or consuming.
If nothing else, the charts should make it clear that hedgulation (speculation masked as hedging) is not for the faint of heart, especially when it comes to crude and refined products. Recall it was only a few months ago that many pundits were declaring WTI all but dead as a major oil benchmark. Consider the case of an airline who has hedged their fuel price risk with Brent while their actual fuel costs are more highly correlated to WTI. Since the beginning of the year, they've experienced an "opportunity loss" of about $20/BBL due to the fact that they were hedging with Brent rather than WTI. Based on their financial reports, more than a few airlines are soon to find themselves facing this situation. While they likely haven't experienced any outright losses as both Brent and WTI have been rising, they certainly left a lot on the table, which will ultimately leads to lower profits. In summary, if you're going to hedge, you need to hedge with a product(s) that is the highly (as as high as possible) correlated to your actual exposure.
As an aside, for those wondering what prompted the Brent-WTI spread to briefly collapse in September 2008, between the end of trading on September 19 and 22, prompt WTI futures settled $16.37/BBL higher while Brent "only" settled $6.43/BBL higher as traders plowed into WTI amid concerns of the US government "bailing out" the financial system.
2 min read
It can't be denied that the recent volatility in the oil and fuel markets is proving to be quite challenging for many companies with active hedging...
3 min read
Over the past year, refining profit margins have been quite volatile. As an example, Brent crude oil/gasoil calendar swap crack spreads have traded...
3 min read
As many participants in the bunker fuel market are constantly seeking better strategies to hedge their exposure to fuel price risk, we wanted to...