2 min read
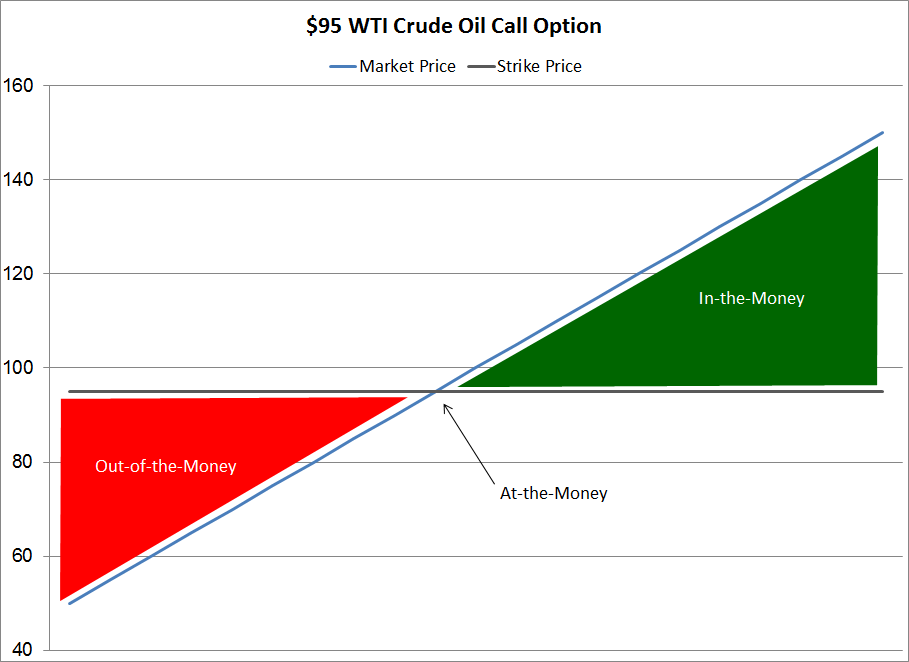
A Beginner's Guide to Crude Oil Options - Part I - Strike Price
We're often asked to explain what determines the price of crude oil (as well as bunker fuel, diesel fuel, gasoil, gasoline and jet fuel) options....
1 min read
2 min read
We're often asked to explain what determines the price of crude oil (as well as bunker fuel, diesel fuel, gasoil, gasoline and jet fuel) options....
3 min read
The prompt month NYMEX WTI contract settled at $107.26/bbl on June 20, 2014. That day would prove to be a major inflection point in the market. The...

3 min read
In a recent Bloomberg article, “In a Risky World, Oil Traders Bet on $100 a Barrel” the author explored how, “Some oil traders have started to gear...